Electricity is a crucial component of modern society, and keeping track of its consumption and forecast is essential for various industries. In this technical blog post, we’ll explore how to use the Fingrid API to get data about electricity consumption and forecast in Finland and display it using Streamlit. ⚡
Prerequisites
To get started, we need to have a few things set up:
A Fingrid API key. You can get one by filling out the registration form at Fingrid api registration. Python 3.x installed on your machine The following Python libraries installed: requests, json, pandas, datetime, timedelta, and Streamlit
Overview
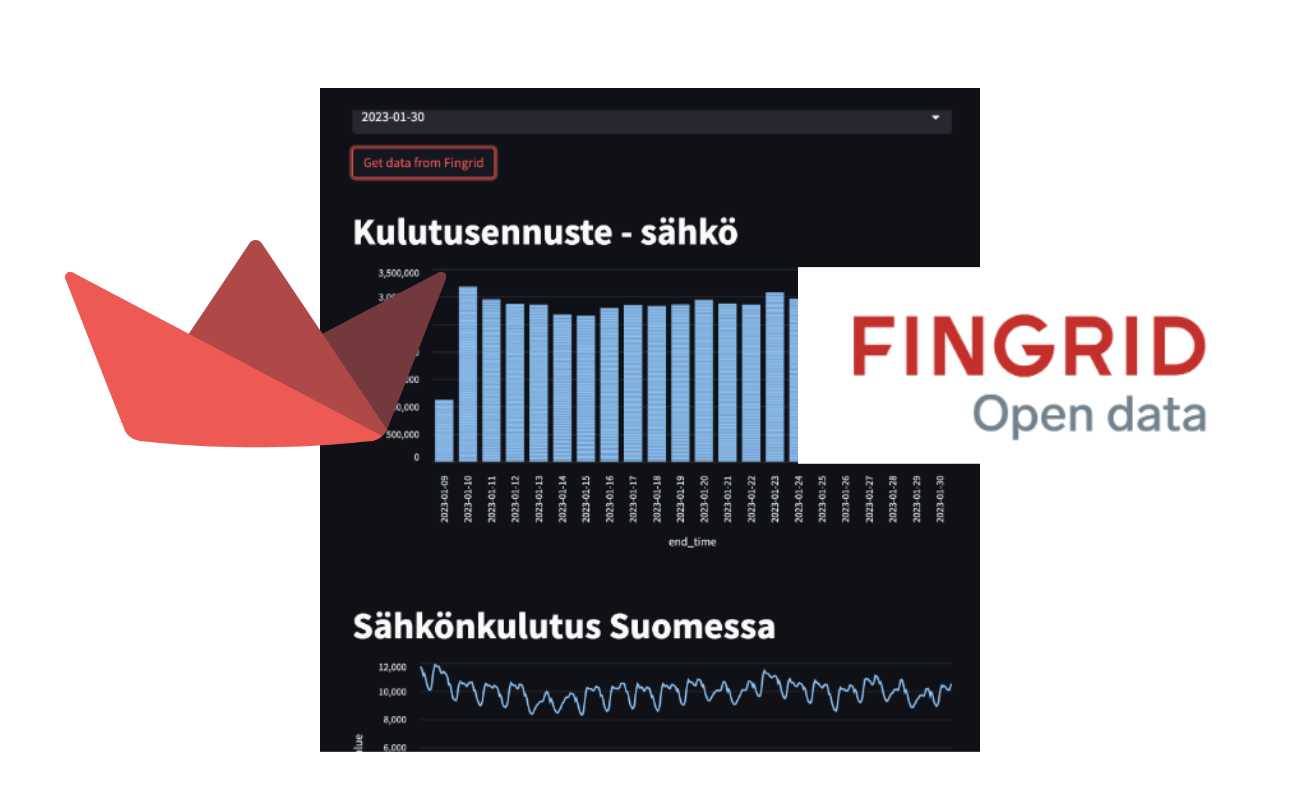
We’ll create a simple web app that allows the user to select a start date and an end date for the electricity consumption and forecast data they want to retrieve. Then we’ll display the data in two charts: a bar chart for the forecasted electricity consumption and a line chart for the actual electricity consumption.
Implementation
We start by importing the necessary libraries and getting the Fingrid API key from Streamlit secrets. Then we define the minimum number of days the user must select and create a list of dates starting from today and going back 90 days. We use Streamlit’s selectbox to allow the user to select a start date and an end date. Finally, we convert the selected dates to the required format for the Fingrid API.
Next, we define a function called get_f_data that takes the start date and end date as arguments and retrieves the electricity consumption forecast data from the Fingrid API. We use the requests library to send a GET request to the API with the appropriate headers and payload. If the response is successful, we convert the JSON data to a pandas DataFrame and format the start_time and end_time columns to a readable date format. We return the DataFrame to be used in the bar chart.
We also define a function called sahkonhinta_now that retrieves the actual electricity consumption data from the Fingrid API. This function is similar to the get_f_data function, but it retrieves data from a different catalog (catalog=124) and returns the data to be used in the line chart.
Finally, we define two functions for the bar chart and line chart using Streamlit’s bar_chart and line_chart functions. We call these functions when the user clicks the “Get data from Fingrid” button, passing the selected start date and end date as arguments.
Conclusion
In this technical blog post, we’ve shown how to use the Fingrid API to retrieve electricity consumption and forecast data for Finland and display it in a web app using Streamlit. This app can be easily extended to include more data and functionality, such as different types of charts or data from other countries. We hope this serves as a useful starting point for anyone looking to work with the Fingrid API or similar APIs for electricity consumption and forecast data.
The code can be found from github Github link