Azure traffic flow
Azure maps provides a great real-time API for exploring traffic. The tile flow indicates traffic on the roads in a specific area. In this demo you will see how to get the 256×256 Azure Maps Traffic Flow tile and create an estimation on how many cars there might be on the road.
Getting started
You will need the key for accessing the API. You need to create a Azure Maps Account.
az maps account create --kind "Gen2" --account-name "myMapsAccount" --resource-group "myResourceGroup" --sku "S0"
Then you will need the key to access the API
az maps account keys list --name "myMapsAccount" --resource-group "myResourceGroup"
The streamlit app code can be found from here
Getting the coordinates from the address
These scripts have elements from Streamlit
There are two azure services used here, one is the azure MapsSearch and the other is Azure traffic flow
Azure maps search
The call the map search and get the address location, you need to run a rest api call. For that you need an auth token. This will return the coordinates, that we will use in getting the traffic tile.
subscription_key = st.secrets["SUBSCRIPTION_KEY"]
maps_search_client = MapsSearchClient(
   credential=AzureKeyCredential(subscription_key)
)
After you have the token, you can call the azuremapssearch api.
def geocode(write_address, zoom):
    from azure.core.credentials import AzureKeyCredential
    from azure.maps.search import MapsSearchClient
    import pandas as pd

    maps_search_client = MapsSearchClient(credential=AzureKeyCredential(subscription_key))
    try:
        result = maps_search_client.get_geocoding(query=write_address)
        if result.get('features', False):
            coordinates = result['features'][0]['geometry']['coordinates']
            longitude = coordinates[0]
            latitude = coordinates[1]

            # Create DataFrame for st.map()
            df = pd.DataFrame({
                'lat': [latitude],
                'lon': [longitude]
            })
            st.title("Map, show the location")
            st.map(df, zoom=zoom)

            # Return coordinates for use in traffic function
            return longitude, latitude
        else:
            st.error("No results")
            return None, None

    except HttpResponseError as exception:
        if exception.error is not None:
            st.error(f"Error Code: {exception.error.code}")
            st.error(f"Message: {exception.error.message}")
        return None, None
Azure traffic flow
The traffic flow uses the az maps key that we got in the beginning.
def get_traffic_flow_tile(longitude, latitude, zoom):
    # Convert lat/lon to tile coordinates
    x, y = deg2num(latitude, longitude, zoom)

    st.write(f"Requesting tile at zoom {zoom}, coords ({x}, {y})")

    url = "https://atlas.microsoft.com/traffic/flow/tile/png"
    params = {
        'api-version': '1.0',
        'style': 'absolute',
        'zoom': zoom,
        'x': x,
        'y': y
    }
    headers = {
        'subscription-key': subscription_key
    }

    try:
        response = requests.get(url, params=params, headers=headers)

        if response.status_code == 204:
            st.warning("No traffic data available for this location and zoom level")
            st.info("Try a different zoom level or location where traffic data is available")
            return False
        elif response.status_code != 200:
            st.error(f"API Error: {response.text}")
            return False

        # Check if response is actually an image
        content_type = response.headers.get('content-type', '')
        if 'image' not in content_type:
            st.error(f"Expected image but got: {content_type}")
            st.error(f"Response content: {response.text[:200]}...")
            return False

        # Check if content is not empty
        if len(response.content) == 0:
            st.error("Received empty response")
            return None

        # Validate the image data before processing
        try:
            img = Image.open(io.BytesIO(response.content))
            img.verify()  # Verify it's a valid image
            st.write(f"Image size: {img.size}")
        except Exception as e:
            st.error(f"Downloaded data is not a valid image: {e}")
            return None

        flex = st.container(horizontal=True, horizontal_alignment="center")

        flex.image(response.content, caption=f"Traffic tile at zoom {zoom}, coords ({x}, {y})")

        return response.content

    except requests.exceptions.RequestException as e:
        st.error(f"Error fetching traffic data: {e}")
        return False
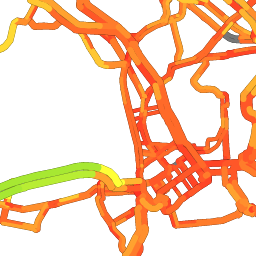
The traffic result should look something like this:
Calculating an estimation of how many cars
This is experimental solution and just for testing. To get a better understanding I would create a hourly cron job to get images over time and then start to calculate a suitable model to get a better understanding how many cars are in the area.
Traffic analysis and car estimation
- Goal: Process a 256×256 Azure Maps traffic flow tile (PNG), detect traffic colors, and estimate a rough number of cars based on how many pixels belong to each traffic state.
Image handling
- Load bytes with PIL; convert to RGB if needed.
- Convert to a NumPy array for pixel-wise processing.
Manual RGB → HSV conversion
- For each pixel, compute Hue (H), Saturation (S), Value (V).
- HSV makes color classification (red/yellow/green) more robust than raw RGB.
Color classification (traffic detection)
- Ignore low-chroma/dark pixels with thresholds: S > 0.2 and V > 0.2.
- Count pixels as:
- Red (heavy traffic): H ∈ [0, 10] or [350, 360]
- Yellow (moderate): H ∈ [20, 40]
- Green (light): H ∈ [40, 80]
- Compute percentages over the sum of red+yellow+green pixels.
Car estimation (heuristic)
- Each tile is 256×256; ground area depends on zoom.
- A per-zoom table defines:
tile_size_km: approximate ground size per tilepixels_per_car: how many pixels correspond to one car at that zoom
- Compute total pixels per traffic category and divide by a pixels-per-car factor:
- Heavy:
0.8 × pixels_per_car(denser cars) - Moderate:
1.0 × pixels_per_car - Light:
1.2 × pixels_per_car(sparser cars)
- Heavy:
- Sum category counts →
estimated_total_cars.
Confidence score
- Based on traffic coverage ratio:
(red + yellow + green) / (tile_width × tile_height)
- Mapped to 20–100% to avoid overconfidence with little colored data.
Assumptions and limitations
pixels_per_carandtile_size_kmare approximate demo calibrations; real use needs empirical tuning.- HSV thresholds may require adjustment per style/lighting.
- Non-road colored areas can bias counts; masking roads would improve accuracy.
- Snapshot only; no lane/speed/direction semantics.
Potential improvements
- Calibrate thresholds and
pixels_per_carwith ground truth per city/zoom. - Use a road network mask to count only road pixels.
- Incorporate speed classes from other Azure endpoints.
- Aggregate across neighboring tiles or time for stability.
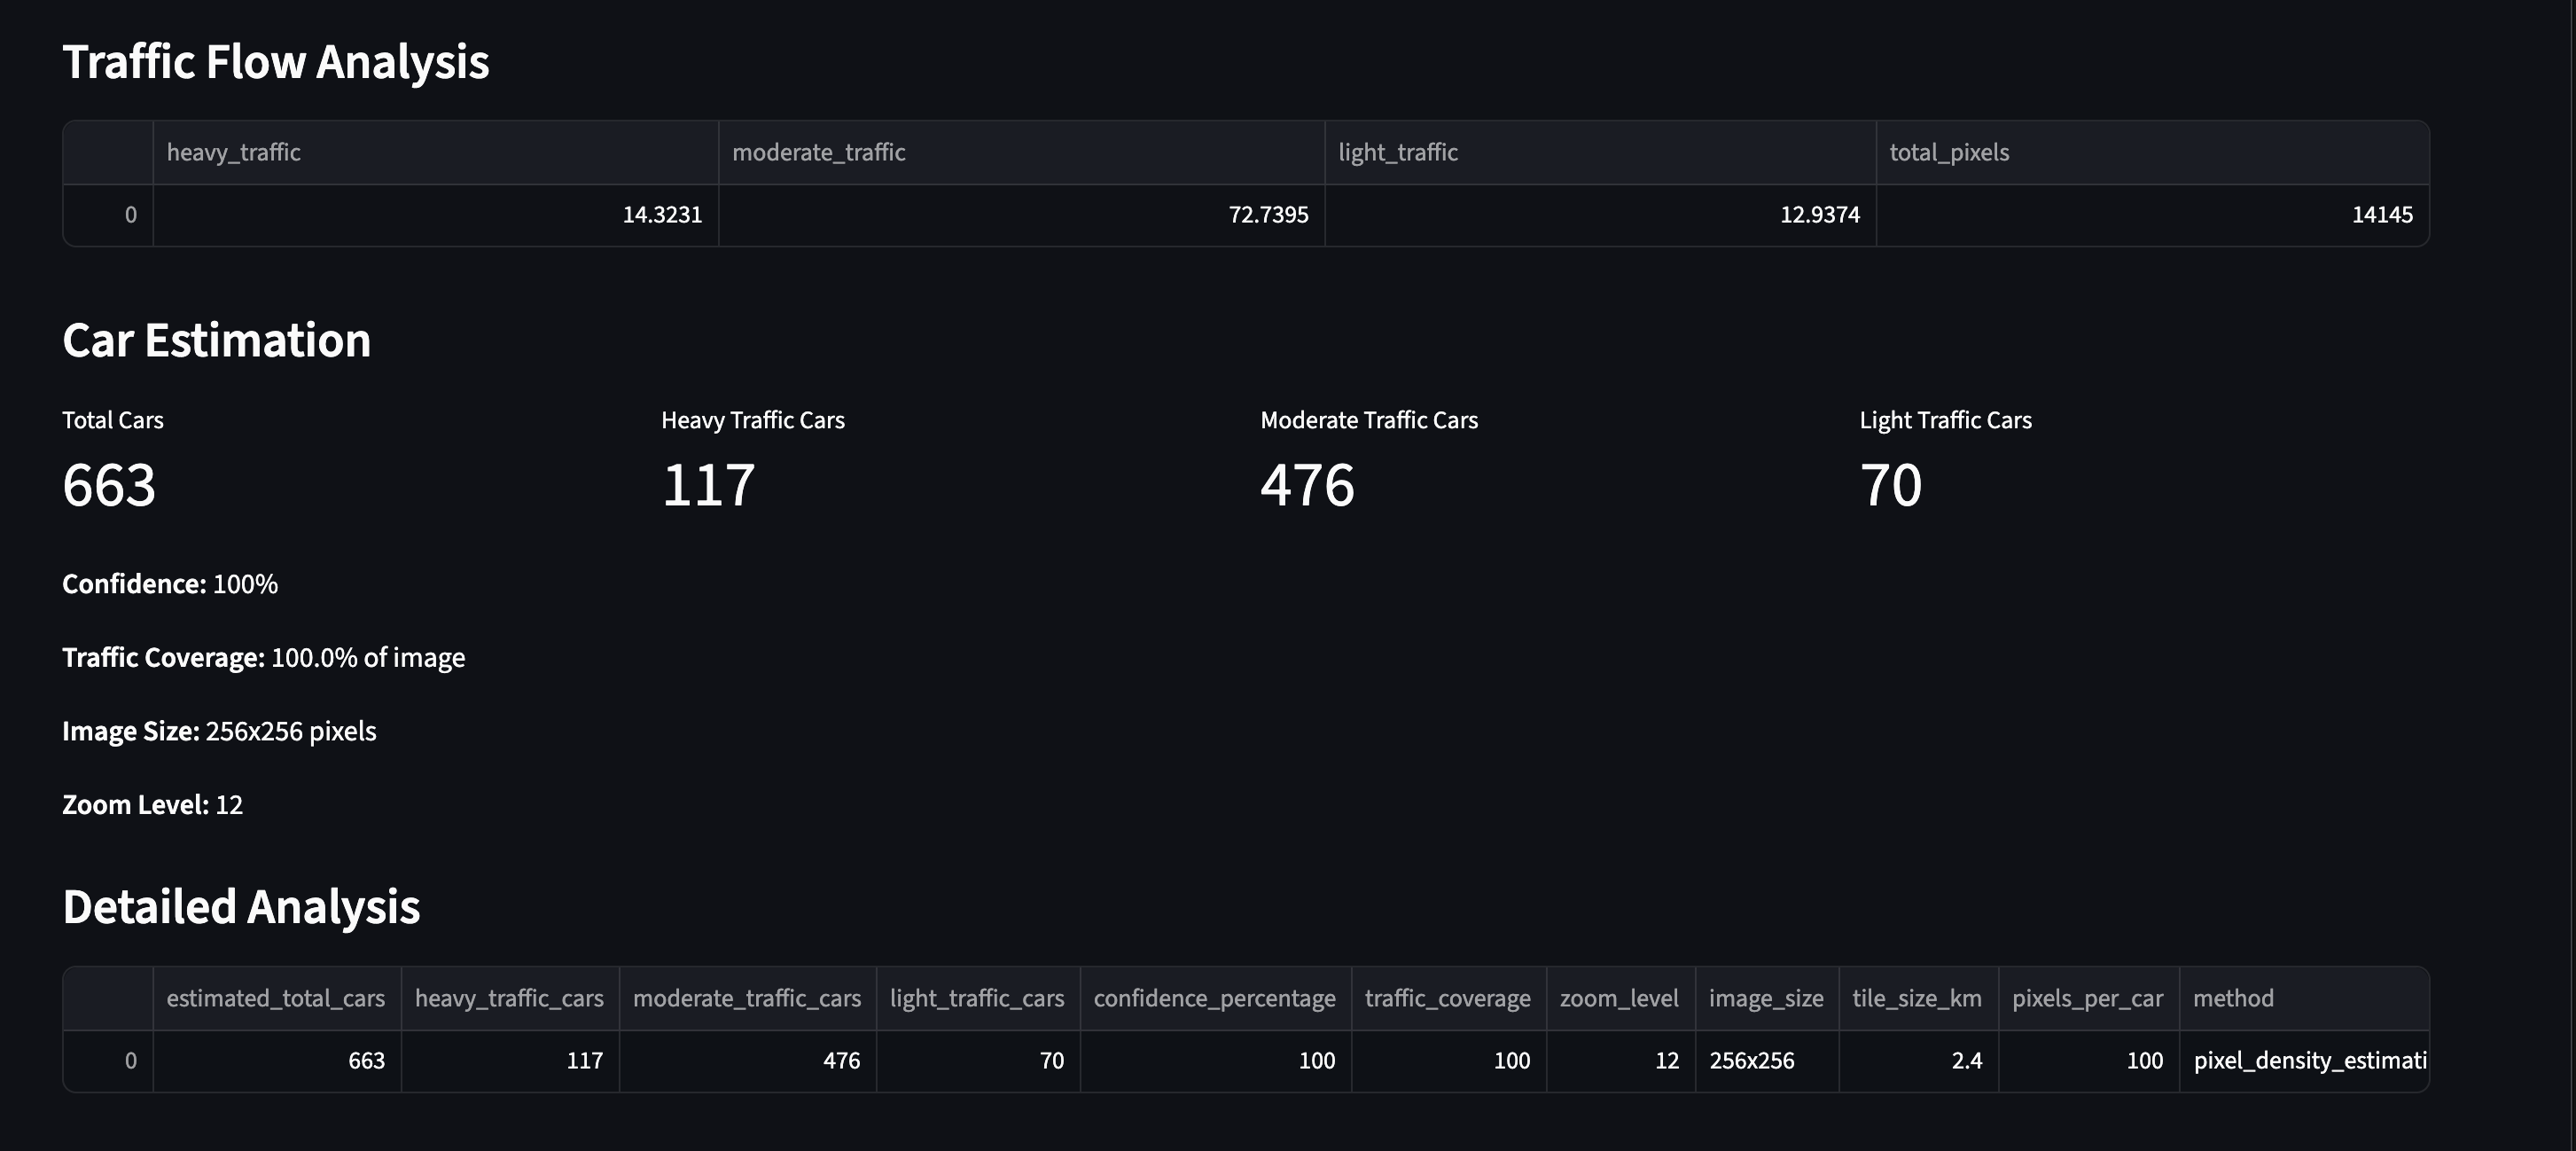
The result would look like this:
What can you do with this?
- Planning shops
- Real-time Display advertisement
- Traffic operations optimization
- Logistics and fleet efficiency
- Public transit planning
- Event and venue operations
- Emissions and sustainability
- Customer experience
- Construction and maintenance scheduling
The API provides also incident information, that could be used on operational level as well.
The streamlit app can be also found from here
Can’t promise it will stay here forever, contact for a demo!